 Success-Plan Services
3 min read

I am part of the RTI services team and we frequently help our users with optimizing performance. To see how we stack up, I recently benchmarked RTI Connext DDS against two open source DDS implementations. You would expect that comparing one DDS implementation with another is easy, but from the length of this blog you can probably guess that this was not the case. To help users navigate some of the common pitfalls when comparing DDS implementations, I decided to write them down in a blog. However, this topic is pretty broad so I’ve focused this blog on latency.
Podcast: Measuring the Performance of Connext DDS vs. Open Source DDS
Let’s first take a look at the two important things to measure when benchmarking latency:
- Round Trip Latency
Latency is the time it takes for one message to travel between a publisher and a subscriber. To accurately measure latency, applications often measure round trip latency, which is the total time it takes for a message to travel from application A to B, and from B back to A. Because A measures both send- and reception time, A and B do not need clock synchronization. - Jitter
Jitter is the variation in time between measurements. Jitter indicates how predictable a DDS implementation is. A high jitter can mean a DDS implementation is more sensitive to operating system load, for example, because it does more allocations or context switches.
Now let's take a look at a few statistics that are typically reported by benchmark tools:
Average latency
This tells you how quick, on average, DDS was able to deliver N messages. Because the average is typically measured over thousands of measurements, it does not tell you much about the jitter (predictability) of your system. Average by itself only provides limited insight into performance.
Minimum latency
This measurement shows latency when there is no (or little) interference from the operating system or network. A minimum is a decent indicator of baseline performance, but it does not tell you whether it is measured incidentally or consistently. Even when combined with average, minimum still does not give much insight into the performance of a DDS implementation.
Maximum latency
This tells you how sensitive a DDS implementation is to interruptions in the environment. A maximum value that is close to the average value is typically a good sign, since it means that the maximum variation is low. Maximums can spike when a DDS implementation heavily relies on memory allocations, context switches or when there is network congestion.
Percentiles
Percentiles are computed by storing all measurements in an array, sorting them by latency, and then taking the measurement at certain percentiles in that array. For example, if the array has 60 measurements, the 50% percentile would take the measurement at index 30. Percentiles are usually taken at 50% (median), 90% and 99%.
Percentiles provide good insight into DDS performance. If a DDS implementation performs more or less the same at the 50% and 99% percentile, but spikes in the 99.99% percentile, you know that no more than 1% of the measurements will be outliers. In other words, in such scenario the middleware behaves predictably 99% of the time.
DDS implementations ship with different tools that measure performance. RTI provides an open source tool called rtiperftest, available on Github, which allows you to run performance benchmarks for a range of different configurations, like message sizes (1B - 64KB), reliability (BEST_EFFORT vs. RELIABLE), transport (UDP vs. TCP vs. SHMEM) and data model (keys vs. singleton).
The different DDS benchmark tools typically do not report measurements in the same way. For example, one tool was reporting the median roundtrip latency over several thousands of measurements, where another tool printed every individual measurement. These numbers are obviously not comparable but to discover how they differed, code inspection was required. Another thing to look out for is whether a tool reports roundtrip latency or one-way latency. Dividing roundtrip latency by two transforms it to one-way latency, and some tools already do this out of the box, whereas others do not.
After ensuring that I was using comparable QoS, network configuration, message sizes, data model and statistics, I started running the measurements. Here are some of the results I got. I used the RELIABLE QoS over UDP on the local loopback adapter. Local loopback eliminates noise introduced by the network and provides insight into efficiency of implementations. This test does not measure the effects of packet loss and network congestion. All measurements are taken on the same hardware and OS (MacBook pro, 2.5 GHz Intel i7 running MacOS).
The first measurement shows the median one-way latency between Connext DDS and two other open source DDS implementations. The message size in this test is 100 bytes. Note how Connext DDS and implementation one are comparable, while implementation two has a higher baseline and also seems less predictable. The measurements are in microseconds:
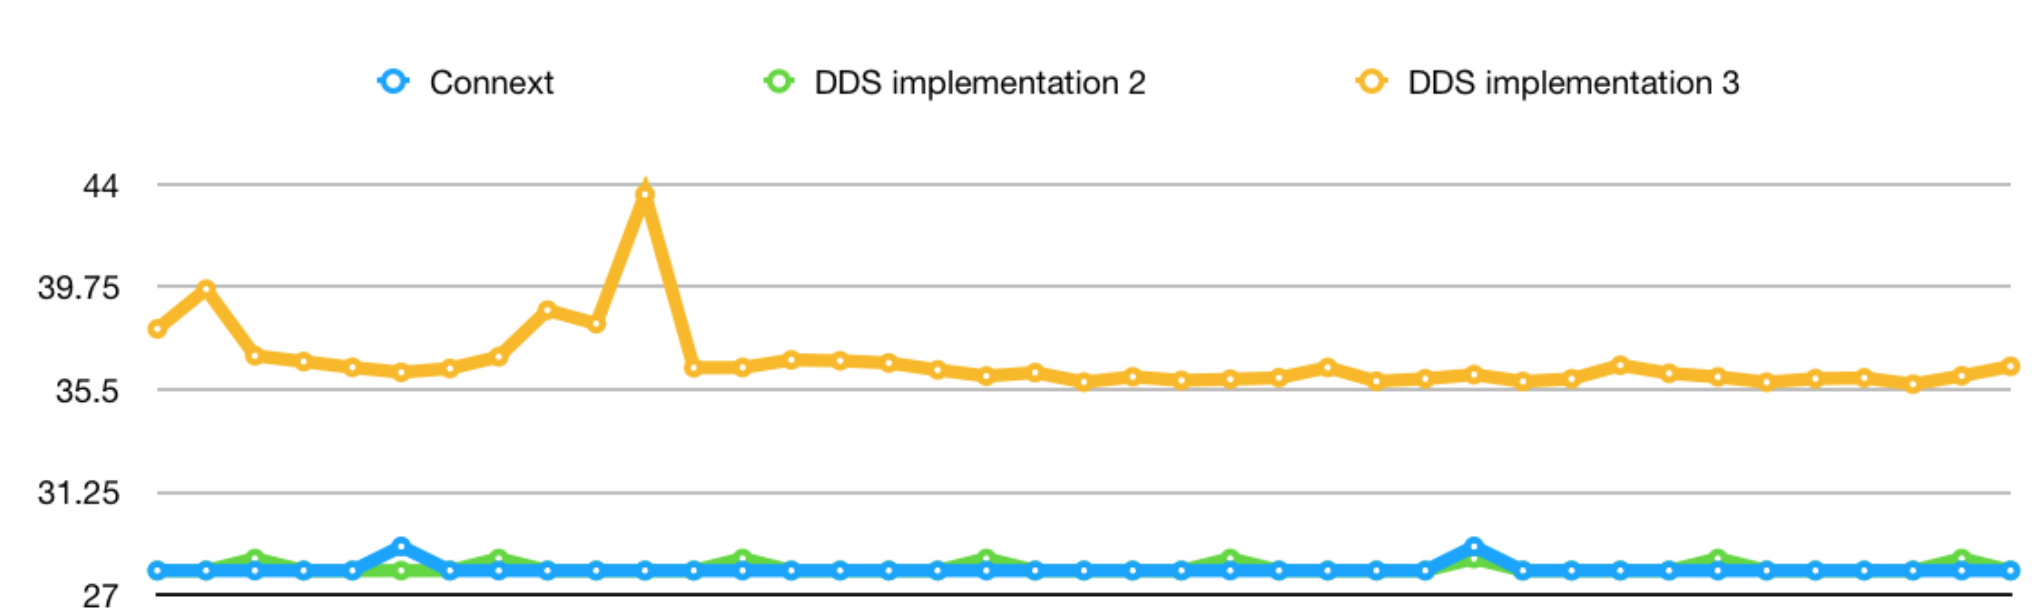
The higher jitter of implementation three is also confirmed when looking at the maximums, where implementation three shows a significantly higher max than both Connext DDS and implementation two:
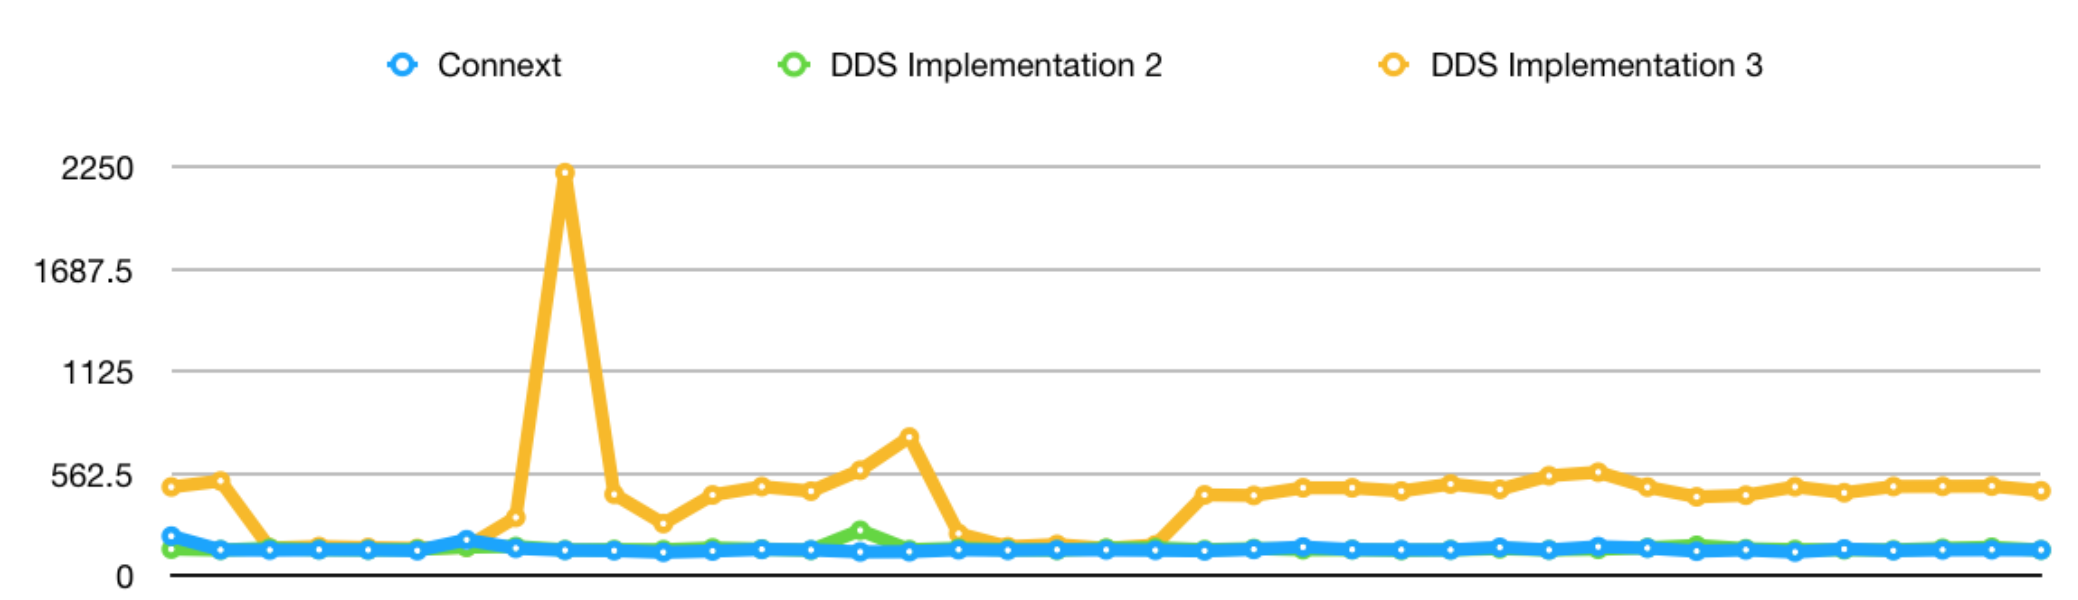
When using a larger message size (64KB), the Connext DDS and implementation three were more or less equal, whereas implementation two is not only significantly higher, but seems to be steadily decreasing in performance:
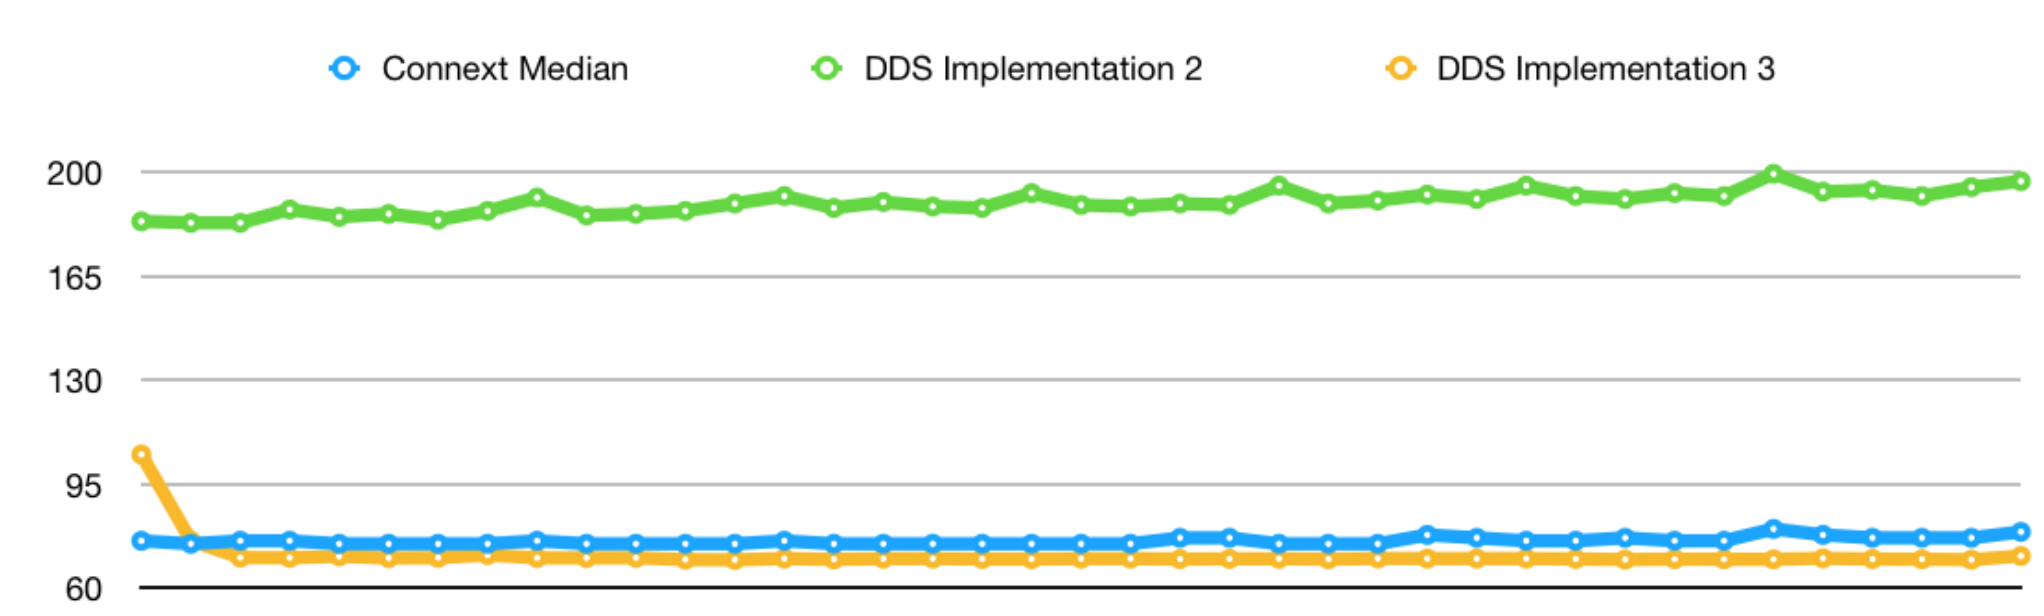
When looking at the maximums for the larger message size, we see that Connext DDS shows mostly predictable performance, whereas the two other implementations have more jitter:
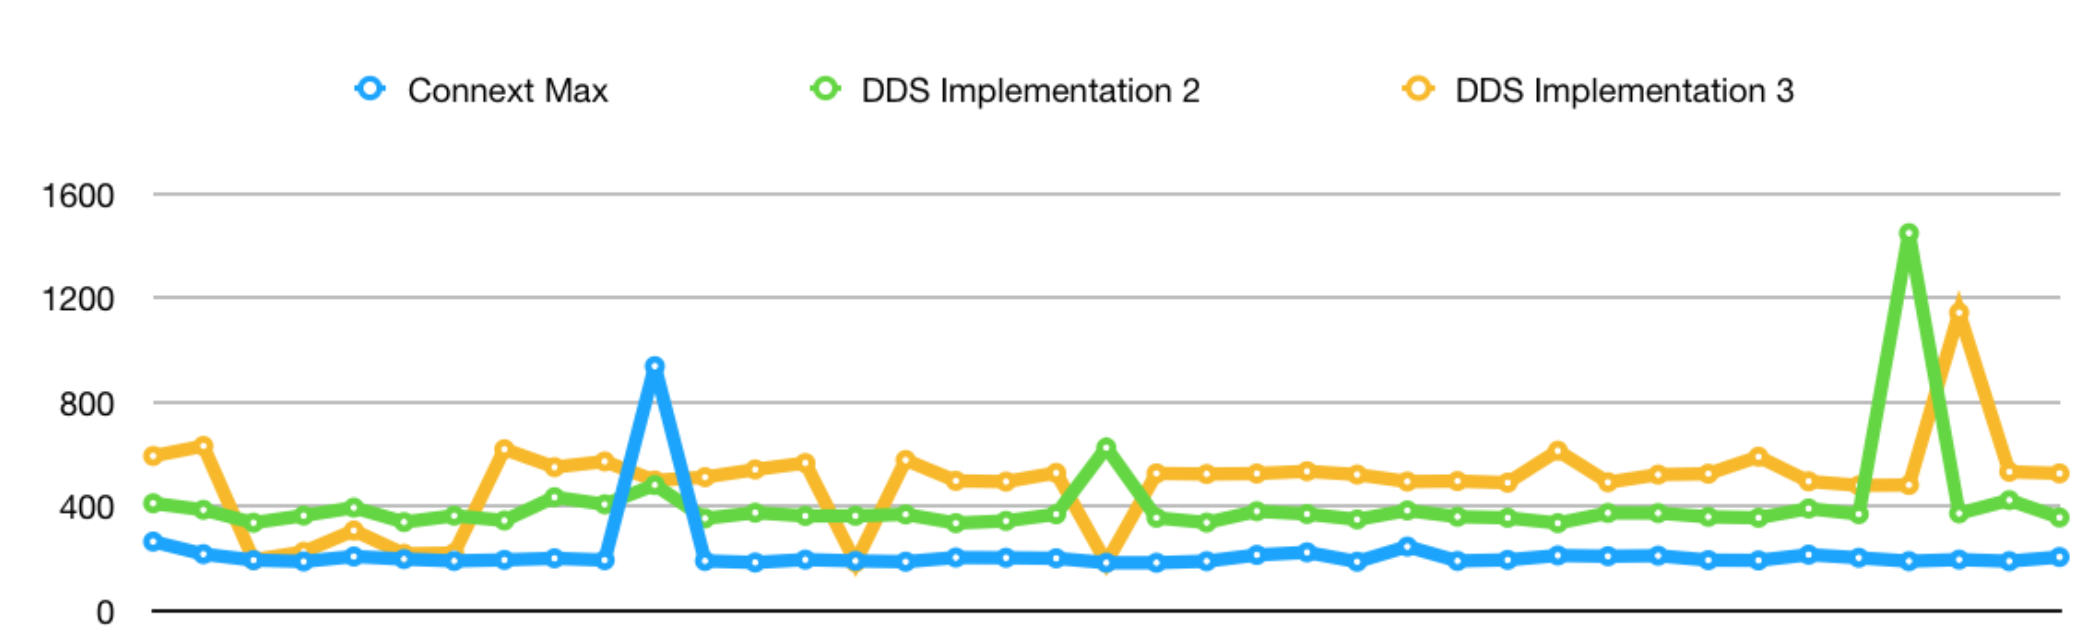
These measurements are just the tip of the iceberg and only tell so much about how the different DDS implementations perform. What these measurements do demonstrate, is that looking at just one number or one benchmark is not enough to get a good overview of how an implementation performs.
We encourage you to create your own benchmarks that are tailored towards your use case and environment. The RTI services team can help you select the right APIs, QoS settings and configuration to get the best possible performance out of your Connext DDS deployment.
Learn more about RTI services here: https://www.rti.com/services