 Success-Plan Services
 Kyoungho An

Note: This blog is a companion to the on demand Influx webinar with interactive demonstration.
Monitoring system performance and health is foundational to the reliability, availability, serviceability and optimization of industrial machines and applications. Building a complete monitoring system often requires a collective software framework for data collection, storage, analysis and visualization. In today’s connected world, however, the software components of the monitoring stack may be deployed in a distributed manner in locations all over the globe, requiring them to be seamlessly integrated over multiple networks. But unless you deploy the right solution architecture, reliable remote monitoring can be difficult to achieve.
Here’s the good news: The RTI Routing Service expertly meets this need by connecting all Data Distribution ServiceTM (DDS) systems over a wide area network (WAN), no matter how geographically dispersed the systems may be. In combination with the InfluxDB stack, which is a collection of software components for real-time monitoring and alerting, RTI Routing Service and InfluxDB can then quickly enable efficient, real-time monitoring capabilities over WAN. I’ll be demonstrating this live on November 5, 2019 during an InfluxData webinar and I hope you can join me there.
In this blog, I want to talk about a more recent effort - funded by the US Department of Energy - to implement a time-series monitoring architecture over WAN using RTI Routing Service and the InfluxDB stack. I will also explain how to configure Routing Service and Telegraf – a plugin-driven agent for collecting time-series metrics - which I used to demonstrate the architecture. Finally, I will provide updates on how to integrate InfluxDB into DDS. For a deep-dive on this topic, please see my previous blog: InfluxDB and DDS integration. Let’s get started!
Implementing a Time-series Monitoring Architecture Over WAN
The following figure describes a deployment architecture example for remote monitoring with RTI Routing Service and the InfluxDB stack over multiple Amazon Web Services (AWS) regions.
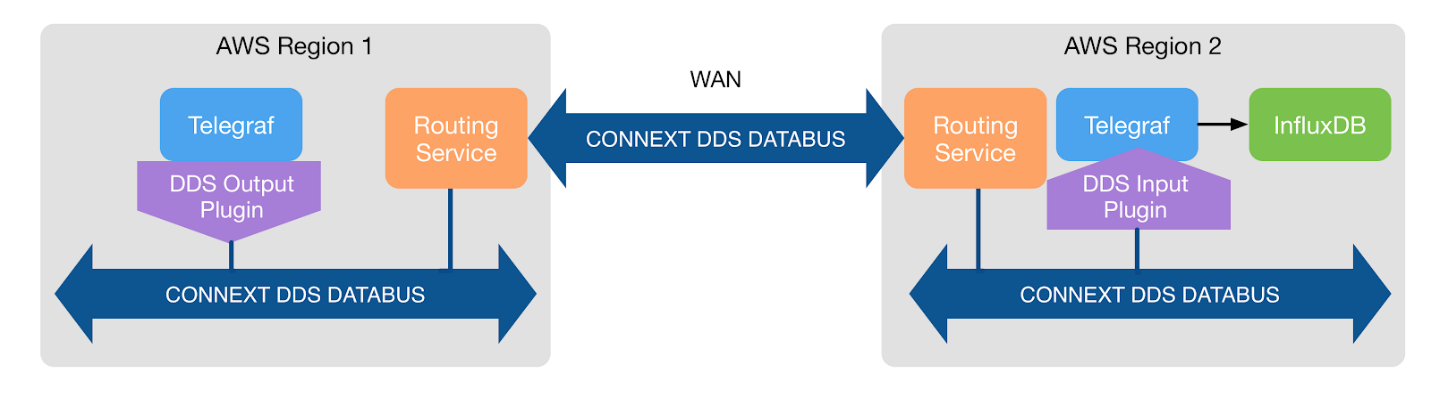
At a high level, the Routing Service in the AWS region 1 delivers monitoring data from the local Telegraf agent over WAN to the Routing Service running in the AWS region 2. Then, the Routing Service in the AWS region 2 ingests the subscribed data to InfluxDB via the Telegraf agent. Please check out this Case and Code example for Routing Service configurations over WAN.
The Telegraf agent in AWS region 1 collects system monitoring metrics (as an example) and publishes them over the local DDS databus. For the local Telegraf agent, we leveraged a Connext DDS output plugin in the Line Protocol format. Notably, with the output plugin, we can collect data from any out-of-the box Telegraf input plugins and publish them over DDS with the data model based on the Line Protocol format. Telegraf has hundreds of plugins, so this could open the door to remotely monitoring data from many of your other systems. To see an example configuration for this Telegraf agent, you can run the following command:
$ ./telegraf --input-filter cpu:mem:net --output-filter dds_producer_lp config
The Telegraf agent in AWS region 2 subscribes to the system monitoring metrics published from the Telegraf agent in AWS region 1 via RTI Routing Service. For this, we used a Connext DDS Input Plugin in the Line Protocol format. Subscribed metrics are ingested to InfluxDB. The following command will show an example configuration for this Telegraf agent:
$ ./telegraf --input-filter dds_consumer_lp --output-filter influxdb config
With this architectural approach, you can achieve the following key benefits:
- Seamless integration of DDS applications in multiple networks: DDS applications in different networks automatically discover each other via RTI Routing Service and communicate without any changes. Accordingly, Telegraf with a Connext DDS input plugin can subscribe to DDS metrics from other networks and deliver them to InfluxDB.
- Analysis and visualization for remote operational data: Once delivered to InfluxDB, remote operational data can be queried for analysis with the InfluxDB stack and visualized with Grafana.
- Content-based efficient data delivery: As DDS is strongly typed and supports content-based filtering, network traffic over the WAN can be reduced by subscribing only to topic data having specific data values (e.g., only send CPU usage above a certain threshold).
Conclusion
This deployment architecture is the first to provide a way to quickly and easily monitor time-series data over WAN with RTI Routing Service and the InfluxDB stack. I also provided updates on the InfluxDB and Connext DDS integration effort. For more on this topic, please register and join me for our November 5 webinar. You can also check out my previous blog and the RTI Labs page if you are interested in this topic.
About the Author
 Kyoungho An is a Senior Research Engineer at Real-Time Innovations (RTI). He has 10 years of experience with distributed real-time embedded systems. His research interest includes publish/subscribe middleware, and deployment and monitoring of distributed systems. He has been leading several DOD and DOE funded research projects as a principal investigator. He has published research papers in journals and conferences focusing on distributed event-based systems, middleware, and cyber-physical systems. He holds a Ph.D. in Computer Science from Vanderbilt University.