
Analyze your Connext system memory usage and detect memory leaks
RTI Heap Analyzer is a debugging tool that allows you to visualize and analyze the memory used by the Connext Professional Library in your application. With an easy-to-use interface, you will be able to understand how and where memory is being consumed.
Introduced in Connext 5.3.0, heap memory snapshot files contain all of the current outstanding memory allocations made by the Connext Professional Library. These provide information to use in analyzing how your DDS application is using system memory. While helpful, the amount of information can be huge, often containing hundreds of thousands of allocations per file.
Heap Analyzer provides a streamlined way to view and analyze heap memory information, via a graphical and human-readable report that can be customized to focus on criteria that is important to you. With Heap Analyzer, you can focus on the information that matters by:
- Analyzing all the heap snapshot files, generating aggregate measurement with inferred de-allocation information.
- Graphically displaying the information using HTML reports containing tables and charts that are customizable with an XML-based configuration file.
- Modifying the program to fit your requirements.
- Distributing as open source to get information on how the data is being analyzed.
Heap Analyzer takes data directly from your Connext application. You only need to decide when to take the heap memory snapshots which are stored as files on your system. Once you’ve taken a snapshot, you can analyze that data using Heap Analyzer according to your preferences.
The analysis process begins by parsing all the data files and merging the information into two aggregated data files. The first is a process-level summary of memory consumption, and the second data file is a record of the individual heap memory allocations (and de-allocations) made by the Connext Professional Library. After this, Heap Analyzer will use the configuration file to generate HTML reports.
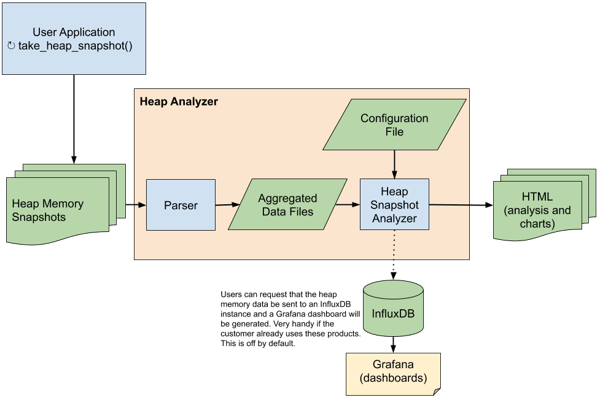
Figure 1: Heap Analyzer simplifies the process of analyzing how your Connext system uses memory. Instead of analyzing multiple files with up to millions of lines, it provides summary information reported in a human-readable way.
Details
RTI Labs Project Type: Debugging tool
Maturity level: Prototype
Support: This is an experimental RTI product. As such, we only offer support through the RTI Community Forum, where fellow Connext users and RTI engineers can help you. This project is provided as open source so you have access to all the code, which you can modify according to your own requirements.
Along with questions you may have, we encourage you to post your feedback on the RTI Community Forum.
Feedback. Please provide feedback via the RTI Community forum.
Product Version Information. This is version 1.0.0, and will run on Connext 5.3.0 and later versions.
Which platform(s) is it compatible with? You can use it on any platform that is able to run Gradle and Java, including Windows, Linux and Mac.
System requirements: Java 8 or later.
Product compatibility: RTI Connext version 5.3.0 and later versions.
Related
If you are interested in using the Heap Analyzer, the following content may also be of interest:
The RTI Developer Community Forum:
- Knowledge Base Post: https://community.rti.com/howto/useful-tools-debug-dds-issues
Next Steps
Join the RTI Community
Search through our knowledge base, find questions and answers to technical questions, or post your own questions in the RTI Community technical forum to get the most from your DDS experience by joining the RTI Community.